A company disclose its shareholding patterns in the financial reports and regulatory filings.
Analyzing a company’s shareholdings pattern is important for an investor as it shows the control dynamics within the company.
Shareholders of a company refers to individuals or entities invested their money in the company’s business. Every individual or entity holding at least one share is known as the company’s shareholder or owner.
In this article, we will discuss what is the shareholdings pattern and how to analyze the shareholdings pattern for stock market trading.
What is the shareholdings pattern?
The shareholdings pattern of a company refers to the distribution of its shares among its shareholders.
The Shareholdings pattern tells you who owns the company. In other words, it tells you about the company’s ownership structure.
In the shareholdings pattern the company shows the percentage of ownership by different categories of investors such as promoters, foreign institutional investors (FII), domestic institutional investors (DII), public and large retail players with more than 1% of ownership.
In other words, the shareholdings pattern provides a breakdown of the ownership of a company’s shares among different categories of shareholders.
A listed company must disclose its shareholdings pattern to the stock exchange every quarter by disclosing holding of promoters and promoter groups, public and non-promoter and non-public shareholders.
Promoter shareholding
Promoter shareholding refers to the ownership stake held by the company’s founders or promoters.
Promoter’s shareholding is significant because it reflects the confidence of the promoters in the company’s future and often influences decision-making and corporate governance.
Public holding
Public holdings refer to the percentage of shares held by the general public which includes individual retail investors, Domestic Institutional Investors (DIIs), Foreign Institutional Investors (FIIs), and other entities, who are not part of the company’s management or promoter group.
Domestic Institutional Investors (DIIs) are India-based institutions such as mutual fund companies, insurance companies, and pension funds that have invested in the company.
Foreign institutional investors (FIIs) are investment entities such as mutual funds, pension funds, hedge funds, and other investment companies operating from outside India that invest in the stocks of Indian companies.
Where can I find a company’s shareholding pattern?
SEBI mandates that a listed company should disclose their shareholding pattern to stock exchanges. Therefore, you can find this information on the website of NSE (National Stock Exchange) and the BSE (Bombay Stock Exchange).
Investors can also find the shareholdings patterns on the company’s website. Typically, this information is published under the company website’s investor relation section.
Another best way to get the shareholdings pattern is the company’s annual and quarterly report, which they publish along with financial statements of the year or quarter.
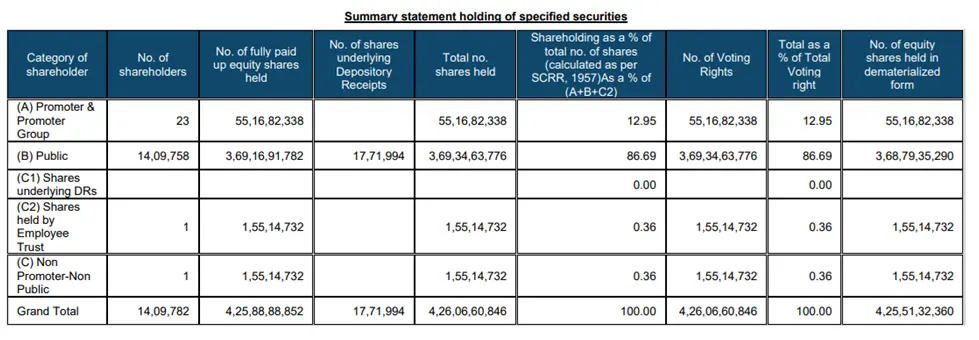
In the shareholdings pattern you will first find a summary section, summarizing the total shareholding structure. Attached to that you will have a detailed break up of the summary section showing who is holding in what percentage of the company.
Here is a screenshot showing how summary section of the shareholdings pattern of a company looks like;
How to analyze the shareholdings pattern of a company?
Analyzing a company’s shareholdings pattern can help an investor to evaluate the risk and potential rewards associated with its share price.
The percentage of promoter shareholding can impact investor perception and the overall stability of a company’s stock.
Investors have to look at how the shareholdings pattern has changed over several quarters or years. Increases or decreases in promoter holdings can indicate confidence (or lack thereof) in the company’s prospects.
If the promoter’s shareholding percentage is high, it indicates strong commitment, while low percentage may raise concerns about management’s confidence in the business.
A decrease in promoter’s shareholding over the years might be a red flag. It indicates promoters are not interested in the company.
Comparison of FIIs and DIIs holding to last quarter or year indicates their confidence in the company’s future. If it’s decreasing period by period, then it might be a warning sign. Whereas, increase in holding indicates that they have confidence in the future business of the company.
Growth in FIIs and DIIs holdings may suggest that the company is gaining credibility and stability.
A comparison of retail investors and institutional ownership indicates confidence in the company. Low institutional ownership suggests low interest by big players. High institutional ownership often reflects credibility.
A high level of retail investor participation in a stock indicates popularity but may also lead to speculative volatility.
As per law, if an individual or entity holds 1% or more in a company, then details of that individual or entity must be disclosed on shareholding pattern. This will indicate how big players are taking interest in the company.
Investigate if any shares of the company are pledged by promoters. High pledged shares can indicate financial stress.Knowing how to analyze the shareholdings pattern in addition to other financial ratios and parameters can help you in investing.