Breakout means the stock quickly turns upward from a sideways move making a new high. In a downtrend, if the stock moves below a support level after trading sideways, then it’s called continuation breakout to the downside.
Breakouts create excellent trading opportunities for traders.
Breakout traders live by the motto, “No price is too high to buy and no price is too low to sell”.
We have two types of breakout:
- upside breakout
- downside breakout
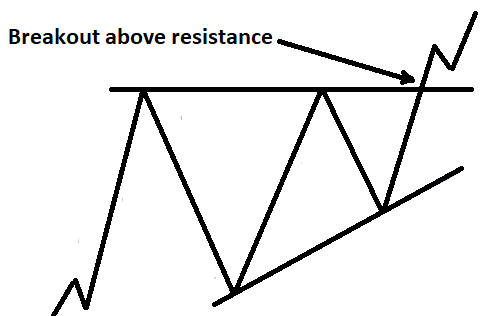
Upside breakout indicates price will go higher, therefore, traders will enter long positions or exit short positions.
Below diagram shows how price after consolidation, breaks out of the range to start moving higher.
Breakout to the downside indicates that prices will go lower and traders should continue their short position or go short, and bulls should exit their long position, if any.
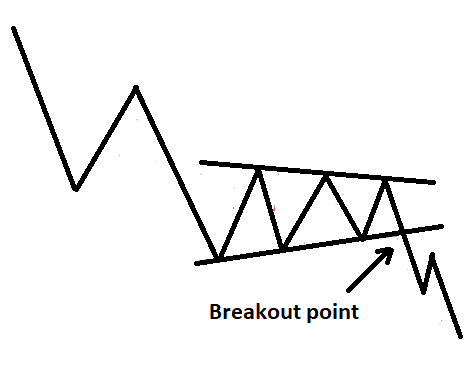
Breakdowns are the opposite of breakouts.
In breakdown, the stock breaks the support base from its trading range to make a new low. Traders in breakdown, look for shorting opportunities. A breakdown often signals the start of a downtrend.
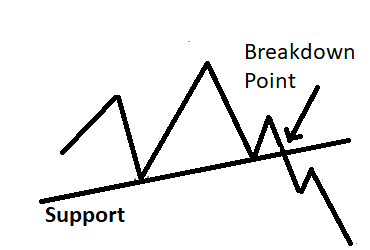
In other words, a breakout to the downside is known as breakdown. A breakdown is a bearish counter part of breakout.
Volume confirmation on breakout and breakdown
To get confirmation on breakout and breakdowns, traders look for volume of the bar that causes the breakout/breakdown and the follow up bars to understand the intensity.
Volume is a fantastic indicator of momentum. If it’s a healthy uptrend or downtrend, then you will see volume shrink on consolidation or pullback before breakout or breakdown.
Beware of low volume breakdowns or breakouts. Odds are they will fail. The simple reason for such failure is that the breakout or breakdown is not supported by an increasing amount of buyers.
If you get strong volume on breakdowns or breakouts, it means the price will potentially continue in the current direction.
High volume in the context of overextended up or down trend, on a doji, evening star, morning star, shooting star or spinning top, when appearing in the context of an overly uptrend or downtrend, indicate an upcoming price or trend reversal.
What a Breakout and breakdown indicates
In general, a valid support and resistance level should be respected by the market participants.
If price cleanly breaks through a significant level with high volume, it indicates that the catalyst behind such a forceful move is so strong that it might drive price even further in the same direction after the breakout.
When price nears significant support and resistance levels, traders pay attention to the price action to know whether the level is respected or violated. Based on how prices react to these support or resistance levels, traders take buying or selling decisions.
When price breaks out above a resistance level, traders would then consider that broken resistance level as a new support level. Similarly, when price breaks down below a support level, traders consider that broken support level as a new resistance level.
Breakout trading is a great strategy. Whether you use intraday, daily, weekly charts, the concepts are universal. You can apply breakout strategy to any type of trading style.
How to trade breakout and breakdown
When the price of a stock moves above the top of its resistance zone, it’s considered as a breakout. Conversely, when the price of a stock moves below the bottom of the support zone, it’s considered as a breakdown.
Many traders wait for a candlestick close above the resistance or below the support level at the point of breakout or breakdown before taking a trade.
Breakouts and breakdowns are commonly associated with chart patterns like Flags, Wedges, head-and-shoulders, pennant, and triangles.
Aggressive traders enter at the point of breakout or breakdown.
Conservative traders wait for the price to retrace to the point of break before moving in the direction of break again. After retracement of price, they take a trade with a stop loss above the breakout or breakdown candlestick.
If price does not move in the direction of breakout or breakdown after retrace, then it will be considered as a “failed breakout” or “fakeout”.
Remember, support and resistance levels are subjective. If you get a high volume breakout or breakdown, then those levels at the point of break are important. Lack of volume shows that the levels are not important as big traders are not participating.
Disclaimer: In addition to the disclaimer below, please note, this article is not intended to provide investing or trading advice. Trading in the stock market and in other securities entails varying degrees of risk, and can result in loss of capital. Most investors and traders lose money. Readers seeking to engage in trading and/or investing should seek out extensive education on the topic and help of professionals.