A wide variety of two candlestick patterns can signal the end of a downtrend or uptrend. Many traders are known for catching the reverse trend, trying to pick a top or bottom of a trending move. This article explains, what the bullish and bearish engulfing candlestick patterns are, how to recognise reversal in a trading environment that give rise to the pattern and when it has less significance to trade.
One of the many classic stock market pearls of wisdom is “the trend is your friend,” meaning an existing trend is likely to continue and worthy of your attention. Many market participants say “The trend is your friend, until the end when it bends.” or ‘the trend is your friend’, in reality, it’s only ‘until the bend at the end’.
But the question is how to identify a turn in the trend? How to know what’s going to happen?
To identify a change in trend, market participants follow indicators and patterns such as relative strength indicator (RSI), Stochastic, MACD, Support & Resistance and candlestick reversal patterns. It helps them to determine when a change in trend is about to happen. One of such candlestick patterns which indicates a change in trend is “bullish and bearish engulfing candlestick patterns”.
Bullish Engulfing candlestick pattern
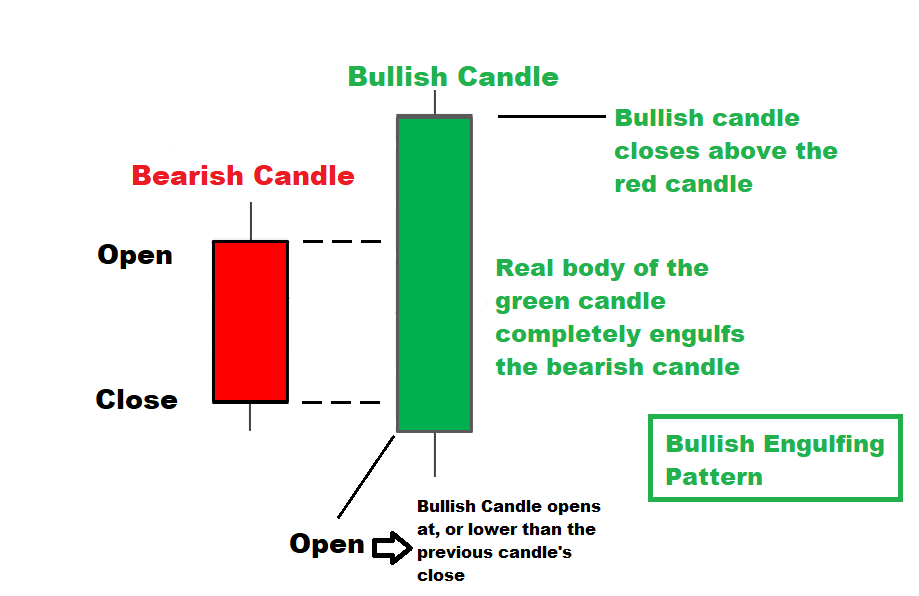
Bullish engulfing pattern is a two candlestick pattern that appears at the bottom of the downtrend. It immediately prompts the trader that buyers are above to take control.
When a bullish candle completely covers the previous bearish candle, the pattern formed is known as a bullish engulfing candle. Few traders compare second candle’s real body to the first candle’s real body in order to know whether the 2nd engulfs the 1st instead of wick to wick comparison.
In general, the opening of the second candle is lower than the first candle’s real body and the close is above the first candle’s real body that is engulfed.
Here is a perfect bullish engulfing candlestick pattern. You will have many variety of this in a chart.
Trading activity that creates the bullish engulfing pattern is extremely bullish based on the previous price patterns.
In a daily chart here are the rules of recognition;
- Downtrend must be in progress.
- On day one, the bear dominates by pushing the price down all day until the close ends up the low. This means the first day should be a red candle confirming continuation of the bearishness in the market.
- On day two, bears open up the price a bit lower but bulls fight back in to close the day way above the previous day’s bearish candle. In other words, the second day’s price action completely engulfs the first day.
When a bullish engulfing candle occurs in a downtrend, that indicates that the bulls are about to take control, therefore it’s known as a bottom trend reversal indicator. In other words, the counterattack by the bulls on the second day completely nullified the downward move created by bears.
Bearish Engulfing Candlestick Pattern
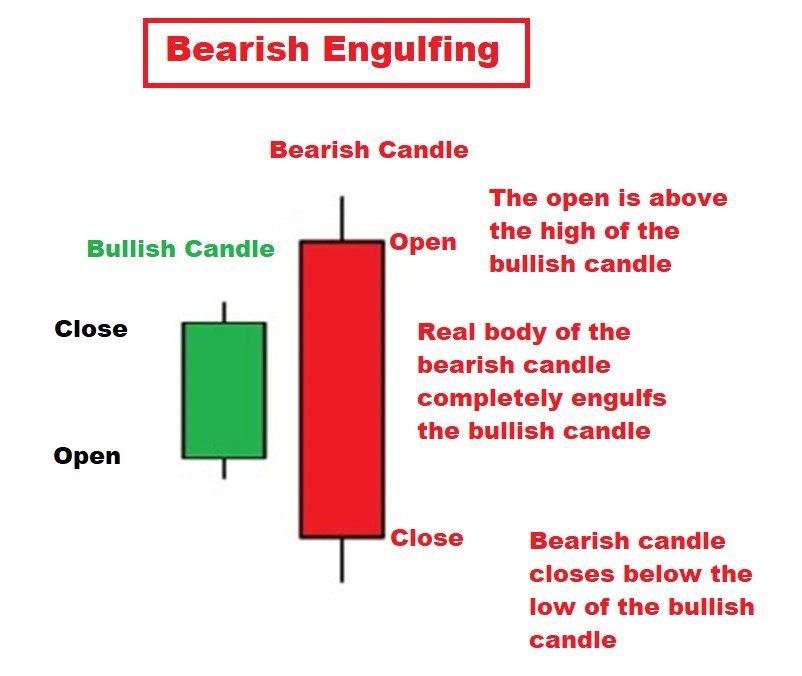
Instead of a bullish candle, when a bearish candle completely engulfs the previous bullish candle at the top end of the uptrend, the pattern formed is referred to as bearish engulfing candlestick pattern.
This means, a clear uptrend is in place, bulls continue the trend on the setup candle, and then suddenly, the next candle opens up higher, which shows bulls pushing the price much higher, but then the bears suddenly take control to push the price much lower than the previous day’s low.
In other words, the bearish engulfing pattern consists of a bullish candlestick followed by a large bearish candlestick that engulfs the previous bullish candle.
In a daily chart here are the rules of recognition;
- Uptrend must be in progress.
- On day one (setup day), the bull dominates by pushing the price up all day until the close ends up higher. The bulls control the setup day.
- On day two (signal day), bulls open up the price a bit higher but bears fight back in to close the day way below the previous day’s bullish candle. In other words, the second day completely engulfs the first day.
When a bearish engulfing candle occurs in an uptrend, that indicates the bears are about to take control. The push by the bears that ended an uptrend is the key to the bearish engulfing candlestick pattern. In other words, the bears on the second day completely nullified the control of the bulls created on the first day. It shows sellers have overtaken the buyers and are pushing the price more aggressively down than the buyers were able to push it up.
Market participants look not only at the two-candlestick reversal pattern which forms a bullish engulfing pattern but also the preceding candlesticks. Remember, two candlesticks patterns are not bullet-proof, the larger context of the market is more important than two candlesticks.The price action prior to the pattern formation will give a clearer picture of whether the bullish engulfing pattern marks true reversal.
If you flip an inside or Harami candlestick pattern horizontally, you will get an engulfing pattern.
These patterns can occur anywhere, but it has more significance if it occurs after a climatic price advance. The pattern has less significance in the choppy market. In a choppy or ranging price action, these engulfing patterns might occur but they are unlikely to result in major price moves.
Downtrend reversal can be identified with hammer and bullish engulfing patterns formed at the bottom of a downtrend. Similarly, an uptrend reversal can be signaled when an inverted hammer or bearish engulfing pattern forms at the top of an uptrend.
You can use other tools such as volume, support and resistance in conjunction with these candlestick patterns. Remember, an engulfing candle strategy signal doesn’t mean that the trend will always resume. That is why a stop-loss is mandatory.
Summary
- A bullish engulfing pattern in a daily chart is a green candlestick that opens lower than the previous day’s closing price and closes higher than the previous day’s opening price. Remember, aggressive traders compare the real body of the second candle to the real body of the first candle to confirm the engulfing pattern, however, conservative traders prefer to compare wick to wick to get confirmation. It’s considered as more bullish when four or more bearish candlesticks, showing a downtrend, is followed by a large bullish candlestick, which completely overlaps or engulfs the previous bearish candlestick.
- In a bearish engulfing pattern, the first candle after an uptrend, is a bullish candle. The second candle is a larger down candle that fully engulfs the previous bullish candle. Bearish engulfing pattern after an uptrend, indicates lower price to come. It’s considered as more bearish when four or more bullish candlesticks, showing an uptrend, is followed by a large bearish candlestick which completely overlaps or engulfs the previous bullish candlestick.
- Sellers are taking over from buyers in the bearish engulfing pattern, and buyers are taking over from the seller in the bullish engulfing pattern.
- A bullish engulfing pattern appears in a downtrend. Bearish engulfing pattern appears in an uptrend.
Here is a list of candlestick patterns for your reference;
- Evening Star
- Morning Star
- Bearish Abandoned baby candlestick pattern
- Bullish Abandoned baby candlestick pattern
- Three Inside up/down
- Three outside up/down
- Inside Bar
- Bullish Piercing
- Dark Cloud Cover
- Spinning Top
- Shooting Star and Inverted Hammer
- Hammer & Hanging Man
- Gravestone, Dragonfly and long-legged Doji
- Spinning Top
- Marubozu
Be sure you practice identifying and trading these candlestick patterns on a demo account before trading them with real money.
In addition to the disclaimer below, please note, this article is not intended to provide investing or trading advice. Trading in the stock market and in other securities entails varying degrees of risk, and can result in loss of capital. Most investors and traders lose money. Readers seeking to engage in trading and/or investing should seek out extensive education on the topic and help of professionals.