A flag is a price pattern in technical analysis which is formed as a parallel narrow trading range in between a strong up-trend or down-trend. It suggests a continuation of the current trend.
As the name of the pattern “flag” implies, this formation looks like a flag on a flagpole in the price chart.
The pole is the result of a vertical rise (in an uptrend) or decline (in a downtrend) in price and the flag results from a period of small consolidation.
A flag pattern indicates that there is a strong directional move followed by a small, slightly counter trend retracement or consolidation.
In other words, a flag is an upward trending or downward trending tight consolidation in price action showing a counter trend move that follows directly after a sharp directional movement in price.
The flag portion of the pattern must run between two parallel lines and can either be slanted up, down, or even sideways.
Upward trending flag pattern in a downtrend is known as bullish flags and downward trending flag pattern in an uptrend is known as bearish flag. Both are considered as good continuation price patterns.
In a rising market, traders ideally trade a flag pattern that is sideways or angled down (moving opposite to the strong up move). Likewise, in a falling market, traders prefer to trade a flag pattern that is sideways or angled up (moving opposite to the strong down move).
The shape of the flag pattern is not important compared to the underlying psychology behind the formation.
In a rising market, it indicates that despite a strong rally, underlying security refuses to drop as bulls are not waiting for better prices and are buying every chance they get.
In a falling market, it indicates that despite a strong downtrend, underlying security refuses to rise as sellers are not waiting for higher prices to sell and are selling at every chance they get.
Here is a diagram to show you how flag patterns are formed in the price chart and how they appear visually.
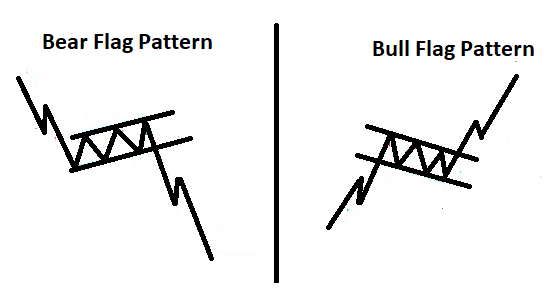
This means, in a rising market, the flag pattern is formed with a slight downtrend. Likewise, in a falling market, it’s formed with an upward bias.
After breaking the small consolidation phase, chances are that the price will continue the sharp trend in the direction of the prevailing trend.
Day traders and technical analysts consider flag patterns as the most reliable set up to enter and exit a trend that is ready to continue.
In a bullish flag pattern formation, to enter a trade, traders expect price to break and close above the upper parallel trend line. In a bearish flag pattern formation, price has to break and close below the lower parallel line to enter a trade. Many traders consider high volume at the point of breakout or breakdown as a confirmation to enter a trade.
Technical analysis is not 100% accurate and reliable. Chart patterns are susceptible to false signals and surprise moves. Therefore technical analysts always suggest putting a stop loss to protect every trade.
In a bullish and bearish flag pattern formation, in general, the stop loss point is considered as a point below the opposite side of the flag pattern.
Many traders consider the length of the flag pole as a potential target by projecting it from the breakout or breakdown point.
Don’t get confused between pennant and flag price chart patterns. The pennant pattern looks similar to a flag pattern formation. The only difference is that the small consolidation phase of a pennant pattern is characterized by converging trend lines rather than parallel trend lines. That is why the pennant is referred to as a symmetrical triangle.
Bullish and bearish flag patterns are an integral part of technical analysis. Traders prefer to combine these flag patterns with other forms of technical analysis to maximize their odds of success.
List of Candlestick Patterns for your further studies;
- Evening Star
- Morning Star
- Bearish Abandoned baby candlestick pattern
- Bullish Abandoned baby candlestick pattern
- Three Inside up/down
- Three outside up/down
- Inside Bar
- Bullish Piercing
- Dark Cloud Cover
- Spinning Top
- Shooting Star and Inverted Hammer
- Hammer & Hanging Man
- Gravestone, Dragonfly and long-legged Doji
- Engulfing Candlestick Pattern
- Marubozu candlestick pattern
Disclaimer: In addition to the disclaimer below, please note, this article is not intended to provide investing or trading advice. Trading in the stock market and in other securities entails varying degrees of risk, and can result in loss of capital. Most investors and traders lose money. Readers seeking to engage in trading and/or investing should seek out extensive education on the topic and help of professionals.