If you’re new to investing or trading in the stock market, you’ve probably come across stock market charts. But what exactly are these charts, and why are they so important?
In simple terms, stock market charts are visual tools that show how a stock’s price has moved over time.
By looking at these charts, traders and investors can identify patterns, trends, and make better decisions about when to buy or sell stocks.
In this article, we’ll break down the basics of stock market charts, explain their different types, and discuss why they are so crucial for making smart investment choices.
Whether you’re just starting out or looking to improve your trading skills, understanding charts can help you become more confident in the market.
What Are Stock Market Charts?
Stock market charts are graphs that represent how a stock’s price changes over a certain period.
These charts help you see how a stock has been performing over time and can give you an idea of where it’s headed next.
There are two key pieces of information shown on most charts:
- Price: This is the cost of the stock at various points in time.
- Volume: This shows how many shares of the stock were traded during a specific time period.
By turning this information into a visual format, stock charts make it easier to understand the stock’s movements, trends, and behavior. Whether you’re into technical analysis or fundamental analysis, stock charts are a valuable tool in your investing toolkit.
Types of Stock Market Charts
There are several different types of stock charts used in technical analysis.
Each chart provides different types of information to help traders make informed decisions.
Let’s take a look at the most common types:
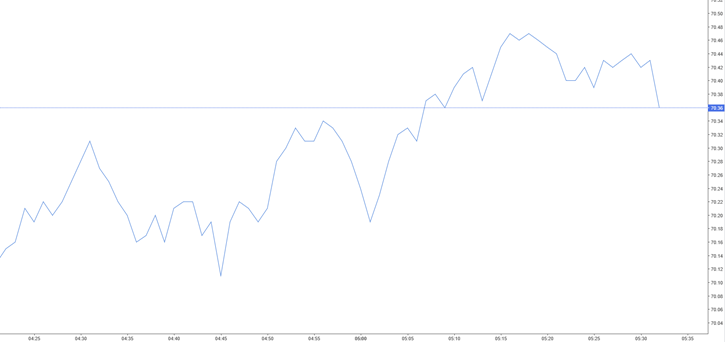
Line Charts
The simplest type of stock chart is the line chart. A line chart connects a series of points that represent a stock’s closing prices over time.
- What it shows: Only the closing prices.
- Why it’s useful: It’s easy to read, especially for beginners. It’s great for seeing overall price trends, without getting caught up in small fluctuations.
Line charts focus on the closing prices, which helps reduce noise from daily ups and downs in stock price.
Bar Charts
Bar charts give more detailed information than line charts. Each bar on a bar chart represents a specific time period (like one day). Each bar shows:
- The opening price (the tick on the left).
- The closing price (the tick on the right).
- The high and low prices during that time period (represented by the length of the bar).
- What it shows: Opening, closing, high, low prices, and trading volume.
- Why it’s useful: Bar charts allow traders to see more detailed price movements within a given time period, making them a popular choice for more experienced investors.

Candlestick Charts
Candlestick charts are another popular chart type, especially for day traders.
These charts originated in Japan and are widely used in the stock market today.
Each “candlestick” represents a stock’s price movement over a given time period.
A candlestick consists of:
- A body (the difference between the opening and closing prices).
- Wicks (the lines above and below the body, showing the highest and lowest prices).
- What it shows: Opening, closing, high, and low prices, with a more visual style.
- Why it’s useful: Candlestick patterns can signal important market trends, such as price reversals or continuations. They are often used by traders to make quick decisions based on short-term price movements.
In candlestick charts, a bullish candle (green or white) means the stock closed higher than it opened, while a bearish candle (red or black) means the stock closed lower than it opened.

Why Are Stock Market Charts Important?
Stock charts are powerful tools that every investor and trader should use. Here’s why they matter:
Reliable Data
Charts reflect actual market data. This means the prices you see on a chart are based on real trades, not rumors or insider information. When you rely on stock charts, you’re making decisions based on facts.
Objective Analysis
With technical analysis, you can base your decisions purely on the information shown in the chart, without letting personal opinions cloud your judgment. Stock charts provide an objective, clear view of how a stock is performing, helping you make more rational decisions.
Historical Performance
By looking at stock charts, you can see how a stock has performed in the past. This helps you understand trends, patterns, and price behavior.
For example, if a stock has repeatedly risen after hitting a certain price, you might predict it will do the same again in the future.
Identifying Trends
Traders often use stock charts to identify whether the market is bullish (prices are rising) or bearish (prices are falling). Recognizing these trends can help traders decide when to buy or sell a stock.
Informed Decision-Making
Stock charts allow traders to make informed decisions about when to enter or exit a position. By recognizing trends and patterns, traders can avoid emotional decision-making and stick to a solid strategy.
Recognizing Historical Patterns
The stock market often behaves in predictable ways. For example, if a stock repeatedly struggles to break through a certain price level, it might do the same in the future.
By studying historical patterns in stock charts, traders can gain an edge in predicting future price movements.
Managing Risk and Timing Trades
One of the best ways to use stock charts is to help you manage your risk and time your trades better.
By recognizing important price levels, such as support (a price level where a stock tends to stop falling) and resistance (a price level where the stock tends to stop rising), traders can set better entry and exit points.
For instance, you might choose to buy a stock near support and sell it near resistance.
Additionally, stop-loss orders can be placed based on chart patterns to help limit potential losses if the stock moves against you.
Using Indicators for Better Insights
In addition to the basic chart types, many traders use indicators (like Moving Averages, Relative Strength Index (RSI), or Bollinger Bands) on their charts to gain additional insights.
These indicators help you understand whether a stock is overbought or oversold, if it’s trending, or if it’s likely to change direction.
Adding these indicators to your chart can provide a clearer picture of market conditions.
Final Tips for Chart Reading Success
- Practice regularly: Spend time analyzing different types of charts and notice how prices move in relation to the patterns you see.
- Use multiple timeframes: Look at the stock’s price action over different time periods (daily, weekly, monthly) to gain a fuller understanding of long-term and short-term trends.
- Combine with other tools: While charts are essential, combining them with fundamental analysis (examining company performance, earnings, etc.) can give you an even better picture.
- Stay patient and disciplined: Don’t jump into trades based on a single chart pattern. Make decisions based on clear trends and data rather than emotions.
With these additional tips and insights, you should be even better equipped to start using stock market charts effectively in your investment journey. Happy trading!
Conclusion
Stock charts are an essential tool for anyone interested in trading or investing in the stock market. By using charts, you can understand how stocks are performing, spot trends, and make smarter decisions about when to buy or sell. Whether you’re using line charts, bar charts, or candlestick charts, these visual tools can give you the insights you need to navigate the market with confidence.
Remember, stock charts aren’t just about looking at past prices—they can also help you predict future movements, giving you an edge in the competitive world of investing.
So, whether you’re a beginner or an experienced trader, learning how to read and analyze stock market charts is a key step toward becoming a successful investor.
By practicing and honing your skills, you can boost your chances of making more informed and profitable trading decisions.