Chart patterns are carefully analysed by technical analysts to place a trade in the stock market. These chart patterns apply to all time frames irrespective of the type of trade you do.
This means, you can apply principles of price chart patterns to any time frame, from one-minute candlesticks all the way to daily, weekly or monthly candlestick charts.
Before getting into classic continuation chart patterns, let us understand what chart patterns are.
What are chart patterns?
In technical analysis, chart patterns are price action formations on a chart that take on the form of certain shapes.
Examples include triangles, flags, pennants, double tops and bottoms, triple tops and bottoms, and head and shoulders, among many others.
We have broadly following two types of chart patterns;
- Continuation chart pattern, and
- Reversal chart pattern
What is continuation chart pattern?
In a prevailing trend, the continuation chart pattern causes pauses or consolidation. Few traders say the stock is resting for a moment.
After consolidation, the stock generally breaks in the direction of the trend.
If it breaks to the upside, it’s known as a breakout. Conversely, if it breaks to the downside, it’s known as a breakdown.
After the break, the stock resumed the prevailing trend. Most common continuation chart patterns are called flags, pennants, and wedges.
This means, these continuation chart patterns are considered to continue a trend more often than not.
Let us discuss 3 classic continuation chart patterns in price action.
Flag
A flag is a parallel narrow trading range formation in between a strong rising or falling market.
This continuation chart pattern indicates that there is a strong directional move followed by a small short-term counter trend consolidation.
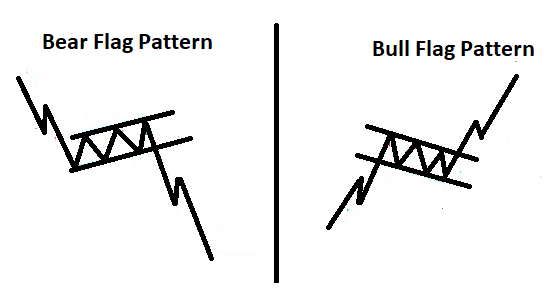
After breaking the consolidation zone, stock might continue the sharp trend in the direction of the prevailing trend.
Know more about flag chart patterns here.
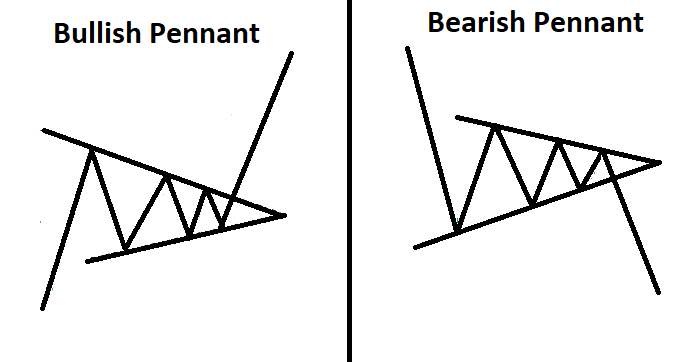
Pennant
A pennant is composed of an ongoing trend and then followed by a small converging consolidation that looks like a small symmetrical triangle.
This continuation chart pattern indicates a strong directional move which is followed by a short-term consolidation that is often somewhat counter to the trend.
After breaking the consolidation phase, price is likely to continue the sharp trend in the direction of the prevailing trend.
Know more about pennant chart patterns here.
Wedges
Wedges represent market consolidation much like other continuation chart patterns. Sometimes it’s also considered as a reversal pattern.
Know more about wedge chart patterns here.
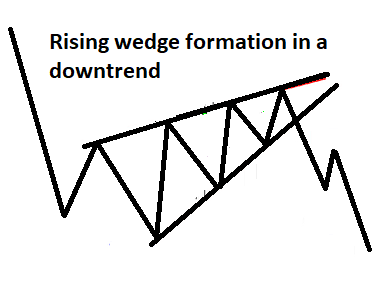
We have two different types of wedge chart patterns.
When price consolidates between two upward sloping lines, it’s known as a rising wedge. On the other hand, when price consolidates between two downward sloping lines, it’s known as a falling wedge.
Rising wedge formed as a continuation to a downtrend is a bearish chart pattern which leads to downward move.
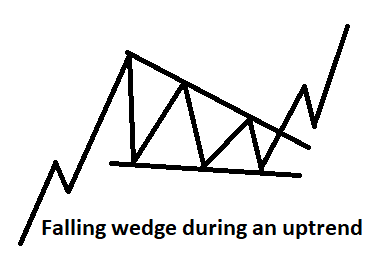
A falling wedge in a rising market is considered as a bullish chart pattern. Therefore, in an uptrend, falling wedge is considered as a continuation chart pattern.
Here is how a falling wedge is created in an uptrend.
These continuation chart patterns can be viewed as consolidations, where the market has decided to slow down for a short-term. In a consolidation phase, depending on the trend, the best potential trading opportunity exists on a strong breakout or breakdown of the consolidation.
Reversal chart patterns are the opposite of continuation chart patterns.
Reversal patterns are generally considered to reverse a trend more often than not.
Two most reliable reversal chart patterns are double tops and bottoms, and the head and shoulders.
Disclaimer: In addition to the disclaimer below, please note, this article is not intended to provide investing or trading advice. Trading in the stock market and in other securities entails varying degrees of risk, and can result in loss of capital. Most investors and traders lose money. Readers seeking to engage in trading and/or investing should seek out extensive education on the topic and help of professionals.