In the world of stock trading, recognizing chart patterns is crucial for making informed decisions. Two significant patterns that traders often analyze are the Double Top and Double Bottom. These formations provide insights into potential market reversals and can greatly influence trading strategies.
This article will explore the meanings, characteristics, and interpretations of these patterns, along with Rounded Top and Rounded Bottom formations.
Double top chart pattern occurs at the top of an uptrend when price moves in a similar pattern to the letter “M”.
Likewise, the double bottom pattern occurs at the bottom of a downtrend when price moves in a similar pattern to the letter “W”.
Don’t expect to have a clear “M” and “W” formation. Just understand the psychology behind the pattern.
Double Tops Formation – M Pattern
A double top consists of two highs that are formed from consecutive rounding tops.
The second top with less volume than the first high confirms a price correction. Technical analysts wait for prices to break the previous low before taking a trade.
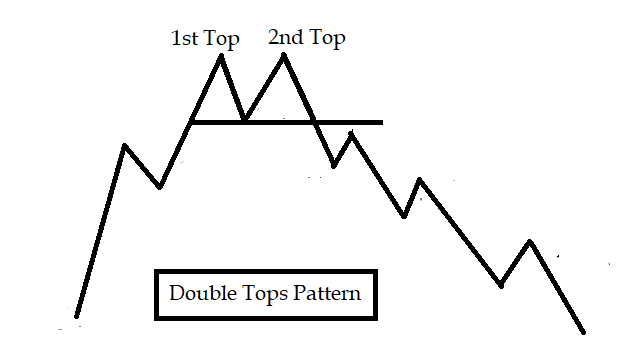
In general, both tops are formed at the same price level. Sometimes, the second top is closed slightly above or below the first top.
Here the characteristics of a double tops pattern;
- The first top develops at the end of an uptrend with high volume. Then prices declined to a low, but did not make a lower low.
- Price rallied back with lighter volume in comparison to the first top as few buyers participated in it. Technical analysts say that prices rallied due less participation of sellers and presence of few buyers. This is a bearish indication.
- Due to less buyer and more seller participation, prices decline from the 2nd high to break the low to complete the pattern.
Many traders use other technical indicators such as RSI, MACD, Stochastic to get confirmation of reversal.
Double Bottoms Formations – W Pattern
Double bottoms price pattern is exactly the opposite of double tops.
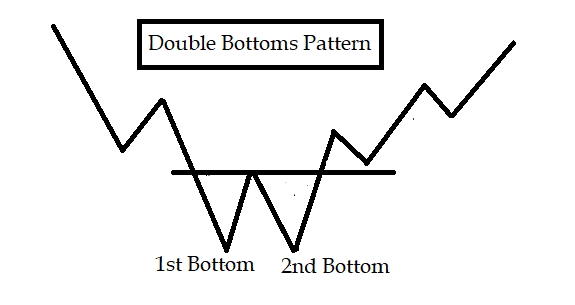
Double bottom is formed after a sharp price decline.
The 1st bottom is formed with a heavy volume, often known as selling climax. Then price retraces up to an extent before retesting the 1st bottom. After forming a second bottom, the price moves up and breaks the previous high to complete the pattern.
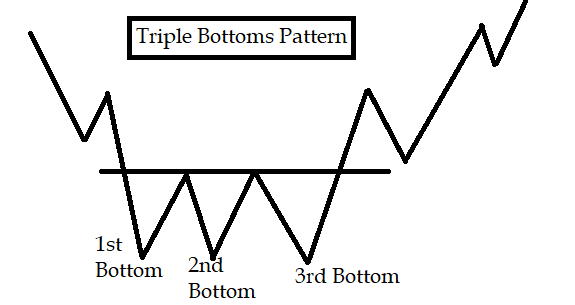
Double tops and bottoms may extend to form a triple tops and bottoms pattern.
Triple tops and bottoms chart pattern
In triple bottoms, following a sharp decline in price, three lows are formed at approximately the same level before breaking the resistance level drawn by joining the highs of the earlier two lows.
Triple tops formed when before breaking the neckline (horizontal line drawn at the previous low), price comes back and tests the earlier high once more.
This means, in the triple top price pattern, the market after a sharp rise in price, makes three highs that form at approximately the same level before breaking the horizontal trendline drawn by connecting two lows formed by earlier highs.
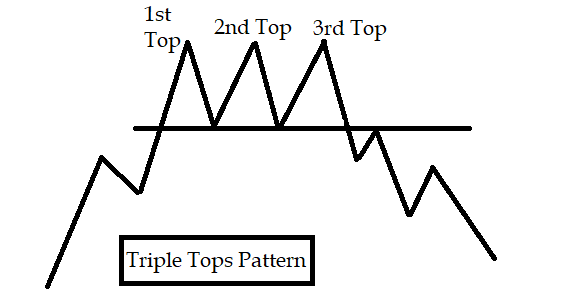
Triple tops and bottoms price patterns are very rare to see in daily charts.
Double tops and bottoms price patterns can be highly effective if identified correctly.
The highs and lows of a double tops and bottoms price pattern do not have to reach exactly the same point in order for the “W” and “M” pattern formation.
Many technical analysts use other technical indicators in addition to chart patterns to get confirmation before taking a trade.
Understanding Double Top, Double Bottom, Rounded Top, and Rounded Bottom patterns equips traders with valuable tools for identifying potential market reversals.
By analyzing these formations alongside volume trends, investors can make informed decisions regarding entry and exit points, risk management, and overall market strategy.
Recognizing these patterns is essential for navigating the complexities of the stock market and enhancing trading success.
By keeping these key concepts in mind, traders can better position themselves to capitalize on market movements, improving their chances for profitable outcomes.
Also Read:
- Type of trends: Uptrend, Downtrend and Sideways
- What is ABCD Patterns and how to trade it
- Head and Shoulders Pattern in technical analysis – Explained