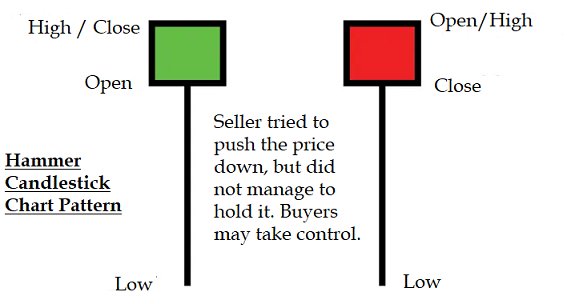
A hammer candlestick is a pattern that forms at the end of a downtrend and suggests a possible trend reversal to an uptrend. This pattern has a long lower shadow (at least twice the size of the real body) and a very short or non-existent upper shadow. The real body, which can be either red or green, represents the difference between the opening and closing prices. A green hammer is usually seen as a stronger bullish signal, as it indicates a close higher than the open.
The hammer candlestick is a signal that the market sentiment may shift from sellers to buyers. In a perfect hammer, the lower shadow is twice the size of the real body, meaning the body is small and the tail is long. The longer the tail, the stronger the potential reversal signal.
The term hammer refers to the shape of the candle and what it indicates about market behavior. A hammer only forms after a downtrend. If a similar pattern appears during an uptrend, it is called a Hanging Man instead of a hammer.
In summary:
- A hammer in a downtrend is a bullish reversal signal.
- A hanging man in an uptrend is a bearish reversal signal.
If you see a doji candlestick pattern instead of a hammer, it can also signal a trend reversal. When a bullish doji star appears, it suggests that the price may shift from a downtrend to an uptrend, similar to a hammer pattern. On the other hand, if a bearish doji star forms in a downtrend, it indicates that bulls (buyers) are about to take control of the market.
Just like a hammer, a hanging man (regardless of color) is seen as a bearish signal, while a hammer (also regardless of its color) is viewed as a bullish signal.
Traders typically look for confirmation after these patterns appear. Confirmation can come from subsequent candlesticks that support the reversal, making the signal stronger and more reliable for potential trade entry.
Understanding the Psychology Behind the Hammer Candlestick Pattern
The psychology behind the hammer candlestick pattern reflects the ongoing battle between buyers and sellers in the financial markets. In simple terms, traders buy a security at a certain price and aim to sell it higher, or they sell at a high price and hope to buy it back lower. This constant struggle is what drives price movements, and understanding the psychology behind each pattern helps traders make more informed decisions.
In a downtrend, when a bearish candle forms, it suggests that sellers are in control. However, when the price drops, buyers quickly step in and aggressively push the price back up. The long lower shadow of the hammer candlestick shows that buyers were able to reject the lower price levels and drive the price back up. Once the price reaches the top of the wick (the long tail), it signals that a market reversal may be happening.
A longer tail on the hammer candlestick suggests a stronger rejection of lower prices and a higher probability of a trend reversal. In contrast, a short-tailed hammer indicates a weaker rejection and, therefore, a lower likelihood of a reversal.
In summary, a long-tailed hammer is often seen as a more significant sign of market reversal, indicating that the buyers have taken control and are likely to push prices higher.
Rules for Recognizing the Hammer and Hanging Man Candlestick Patterns
Hammer Candlestick Pattern:
- Downtrend Market: The market must be in a downtrend, where sellers have control and the price is consistently closing lower.
- New Low Followed by Reversal: After a previous bearish candle, the market makes a new low. However, at this point, buying interest emerges, pushing the price back up.
- Real Body and Wick: The real body of the candle forms at the upper end of the trading range. The lower wick (or tail) should be at least twice the length of the real body, while the upper wick should be very small or nonexistent.
- Color of the Candle: The color (green or red) of the hammer is not as important as the structure of the candle itself, but a green hammer may indicate a stronger reversal signal.
- Sign of Reversal: The hammer pattern suggests that buyers are taking control from the sellers, signaling a potential trend reversal from a downtrend to an uptrend.
Hanging Man Candlestick Pattern:
- Uptrend Market: The market must be in an uptrend, where bulls have control and the price is consistently making new highs and higher lows.
- New High Followed by Reversal: After a bullish candle, the next candle makes a new high, but bears enter the market, pushing the price lower and creating a long lower shadow and a small real body.
- Real Body and Wick: The real body is small and located at the top of the trading range, while the lower wick is long, indicating a rejection of higher prices. There should be little or no upper shadow.
- Sign of Reversal: The Hanging Man suggests that bears are challenging the control of the bulls, signaling a possible correction or trend reversal from an uptrend to a downtrend.
Important Notes:
- Hammer at the Bottom: If a hammer is formed after a long decline, and accompanied by higher volume, it increases the likelihood of a capitulation low, which is a strong sign of a potential reversal and the end of the downtrend.
- Hanging Man at the Top: The Hanging Man in an uptrend suggests that buyers may be losing their strength, and the market could be near its peak, preparing for a pullback or trend change.
Differences Between Hammer, Hanging Man, and Shooting Star Candlestick Patterns
While the hammer, hanging man, and shooting star candlestick patterns may appear similar, they each have distinct characteristics. Here’s a breakdown of their rules of recognition to help avoid confusion:
| Pattern | Hammer | Hanging Man | Shooting Star |
|---|---|---|---|
| Trend Required | Downtrend | Uptrend | Uptrend |
| Open and Close Range | Very tight (small real body) | Very tight (small real body) | Very tight (small real body) |
| Shadow | Lower shadow must be at least twice the size of the body. Little or no upper shadow. | Lower shadow must be at least twice the size of the body. Little or no upper shadow. | Upper shadow must be at least twice the size of the body. |
| Color of the Body | Unimportant, but a green hammer suggests more bullishness. | Unimportant, but a green hanging man suggests more bearishness. | Unimportant, but a red shooting star suggests more bearishness. |
| Probability of Reversal | High, but depends on how sharp the downtrend is. | High, but depends on how sharp the uptrend is. | High, but depends on how sharp the uptrend is. |
Key Differences:
Hammer vs. Hanging Man:
- Both the hammer and the hanging man have small real bodies and long lower shadows, but the trend direction makes them different.
- The hammer forms in a downtrend, signaling a potential bullish reversal.
- The hanging man forms in an uptrend, signaling a potential bearish reversal.
Shooting Star:
- The shooting star is similar to the hanging man but with an upper shadow that is twice the size of the body. The real body is at the bottom of the candlestick, with a long upper shadow.
- A shooting star appears in an uptrend, signaling a potential bearish reversal, much like the hanging man, but it is “flipped upside down.”
Hammer Doji:
- A Hammer Doji occurs when the bottom wick is longer than the top wick, suggesting that sellers failed to push the price lower.
- In a bearish downtrend, a Hammer Doji indicates that bears are exhausted and bulls might take over, signaling a potential reversal.
Understanding the subtle differences between the hammer, hanging man, and shooting star is crucial for traders. While all these patterns can signal a potential reversal, it’s important to wait for confirmation before acting on these signals.
Should You Trade Based on Hammer or Hanging Man Candlestick Patterns?
After learning about candlestick patterns, it’s important not to trade solely based on their formation. While these patterns can be helpful, they are not always perfect indicators. Candlestick patterns should be viewed in the context of other factors, especially experience and confirmation from other technical indicators.
For example, a Doji candlestick indicates indecision in the market, but it does not guarantee a trend reversal. A trend might reverse immediately after the Doji forms, or it might take several more candles to confirm the shift. Experienced traders always look at other factors, like support and resistance levels, before making trading decisions based on candlestick patterns alone.
Many traders use the term “Pin Bar” to refer to several candlestick patterns, including the hammer, hanging man, inverted hammer, and shooting star. These patterns all share a similar shape, with a small real body and a long wick, resembling a “pin.”
- A bullish Pin Bar at the end of a bearish trend is called a Hammer.
- A bearish Pin Bar at the end of a bullish trend is called an Inverted Hammer.
Pin Bar as a Reversal Signal:
A Pin Bar forming at the top or bottom of a trend is often seen as a reversal signal, suggesting that the previous trend is weakening. Traders typically look for:
- A bearish Pin Bar at the top of an uptrend (potential reversal to a downtrend).
- A bullish Pin Bar at the bottom of a downtrend (potential reversal to an uptrend).
Confirmation is essential. Do not base your trade decision on a Hammer or Hanging Man candlestick alone. Use other indicators and analysis, such as support and resistance levels. Candlestick patterns are part of a broader trading strategy and should be considered alongside other factors.
While a Pin Bar can signal a potential trend reversal, there’s no guarantee of a trend change. The market could continue in the same direction, even after a reversal pattern forms. Before trading with real money, it’s recommended to practice recognizing and trading these patterns on a demo account to gain experience and confidence.
In summary, while the Hammer and Hanging Man candlestick patterns are useful for spotting potential reversals, they should not be the sole basis for your trading decisions. Combining these patterns with other technical analysis tools and confirming signals is crucial for successful trading.
Here is a list of candlestick patterns for your reference;
- Evening Star
- Morning Star
- Bearish Abandoned baby candlestick pattern
- Bullish Abandoned baby candlestick pattern
- Three Inside up/down
- Three outside up/down
- Inside Bar
- Bullish Piercing
- Dark Cloud Cover
- Spinning Top
- Shooting Star and Inverted Hammer
- Gravestone, Dragonfly and long-legged Doji
- Engulfing Candlestick Pattern
- Spinning Top
- Marubozu
It’s important to practice identifying and trading these candlestick patterns on a demo account before risking real money. A demo account allows you to gain valuable experience in recognizing patterns, understanding their context, and developing a trading strategy without financial risk. By practicing in a risk-free environment, you’ll become more confident in your ability to spot potential opportunities and manage trades effectively. This helps you build your skills and refine your approach before you start trading with real capital.
Disclaimer: In addition to the disclaimer below, please note, this article is not intended to provide investing or trading advice. Trading in the stock market and in other securities entails varying degrees of risk, and can result in loss of capital. Most investors and traders lose money. Readers seeking to engage in trading and/or investing should seek out extensive education on the topic and help of professionals.