Traders use candlesticks to identify trading chart patterns to set up a trade. Chart patterns are formed with one candlestick or by grouping two or more candles in a certain sequence. These candlestick chart patterns help the trader to develop a complete point of view.
Based on how candlestick chart patterns are formed it can be broken down into single and multiple candlestick patterns.
In our earlier articles we have discussed almost all important candlestick patterns used by traders and investors for a profit. You can refer to those articles for your further studies. We have listed those articles at the end of this write up.
In this article we will discuss the most important single candlestick chart pattern called “Marubozu” and will answer the following questions related to Marubozu.
- What is a bullish Marubozu?
- What is a bearish Marubozu?
- How do you identify and use Marubozu Candlestick Pattern?
What is Marubozu
Marubozu is a Japanese word for dominance.
In candlesticks, when a stock after its opening, trades strongly in one direction throughout the session to close at its high or low price of the session, it shows how one side has dominated the other side for the entire session. Such dominance can be seen in the candlestick chart as a Marubozu candle formation.
Most of the traders have named Marubozu as a breakout candle, Igniting bar, exhaustion candle or a 180 degree reversal based on where and how its formed.
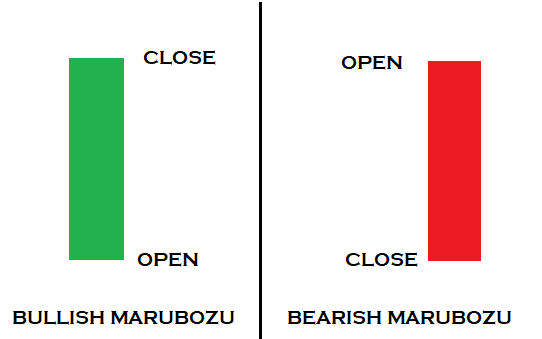
The green candle represents the bullish marubozu and the red represents the bearish marubozu.
Bullish and Bearish Marubozu Candle
In our above diagram, for bullish marubozu, you can see the opening price of the candle is equal to the low and closing price is equal to the high. This implied total dominance by buyers for the entire session. It indicates that market sentiment might change if the bullish sentiment continues.
Likewise, for bearish marubozu, you can see the closing price is equal to the low and opening price is equal to the high of the candle. This shows us how sellers dominated the market for the entire session. It indicates that selling pressure for the stock is so high that market participants sold at every price point during the whole session.
Both bearish and bullish marubozu candles indicate that the security’s price did not trade beyond the range of the opening and closing price. Therefore it has no shadows.
In an intraday chart, you might get a perfect Marubozu candle, however, it’s very difficult to get a perfect text book form of Marubozu candle in daily, weekly or monthly charts.
Here are different forms of Marubozu candles that can be seen in candlestick charts.
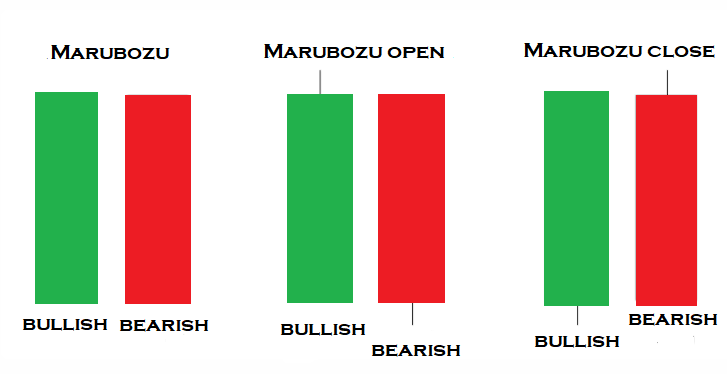
First two sets of marubozu candles without shadow tells you that the market is trending in one direction with complete dominance.
The other two sets of marubozu have small shadows at the close. You will get these kind of candles in higher trading time frame such as daily, weekly and monthly. However it has no impact as the power of buying or selling is so strong that it signals complete dominance of one side. All the candles above signals that the market sentiment is quite one-sided and likely to continue in the same direction.
Identification of trend using Marubozu Candle
When a bullish marubozu type of candle is formed in an up-trend, it signals that the bulls are aggressively buying the security and therefore the momentum is likely to continue upward. However, if a bullish marubozu candle is seen in a downtrend, it indicates a reversal.
For further studies, you can read bullish and bearish engulfing candlestick patterns, dark cloud cover and Piercing patterns.
Likewise if you find a bearish marubozu candle in a downtrend, it indicates that the bears are still in control of the market and therefore the momentum is likely to continue downward. However, if you get it in an uptrend, then it might indicate reversal to the opposite direction.
Therefore, the market context is the most important criteria to find out what a candlestick pattern tells you. Be sure you practice identifying and trading these candlestick patterns on a demo account before trading them with real money.
For further confirmation, you can take help of other technical indicators when generating a buying or selling signal. Be sure you practice identifying and trading these candlestick patterns on a demo account before trading them with real money.
List of Canldestick Patterns;
- Evening Star
- Morning Star
- Bearish Abandoned baby candlestick pattern
- Bullish Abandoned baby candlestick pattern
- Three Inside up/down
- Three outside up/down
- Inside Bar
- Bullish Piercing
- Dark Cloud Cover
- Spinning Top
- Shooting Star and Inverted Hammer
- Hammer & Hanging Man
- Gravestone, Dragonfly and long-legged Doji
- Engulfing Candlestick Pattern
Be sure you practice identifying and trading these candlestick patterns on a demo account before trading them with real money.
In addition to the disclaimer below, please note, this article is not intended to provide investing or trading advice. Trading in the stock market and in other securities entails varying degrees of risk, and can result in loss of capital. Most investors and traders lose money. Readers seeking to engage in trading and/or investing should seek out extensive education on the topic and help of professionals.