In this article, we will let you know about the sideways market and the difference between congestion, consolidation and trading in a range.
When the market is sideways, the stock may make one of three basic patterns: trading in a range, congestion and consolidation. Each of such patterns tells you a different story.
Many times technical analysts refer to a sideways market as choppy markets, range-bound markets, ranging markets or trendless/non-trending markets.
Up and down trends or down and up trends are usually separated by a period where buyers and sellers are equally matched or become indecisive. During this transitional period, price typically moves within a trading range.
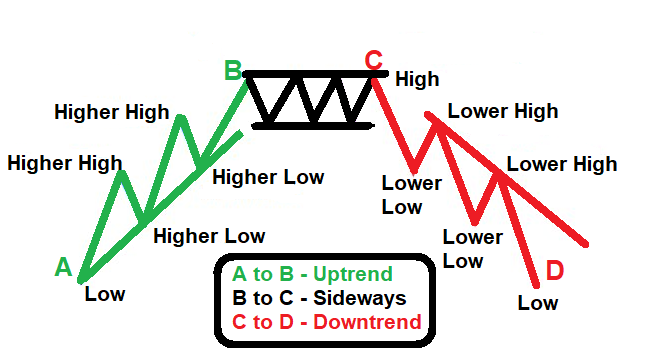
When an uptrend is broken, buyers and sellers even out in strength, and the cycle arcs into a sideways pattern.
During a sideways market, it’s very difficult to know in which way the prices will ultimately break. Until reversal by breaking the support zone happens, you can not say that the pattern is a reversal of the prevailing trend.
No stock goes up or down forever. If stock is moving up for a long time, at some point, it gets exhausted as sellers overtake buyers. At that point of time, the stock either moves sideways or falls in price. The sideways pattern is very frustrating for traders.
A rectangle pattern formation will always not be a reversal of trend. If buyers, after a sideways market, are able to push the prices up by breaking the resistance line, then the rectangle pattern will be referred to as consolidation or continuation pattern.
When sideways market is referred to as a distribution or accumulation phase
When this kind of reversal rectangle pattern forms at the top of an up trend, technical analysts call it a distribution phase if it breaks down by making a lower low. During this period stock distributed from strong hands to weak or uninformed hands.
When a similar reversal rectangle pattern is formed in a downtrend at market bottoms it’s called accumulation phase, where stock passes from weak hand to informed market participants. During this phase, informed buyers are said to be accumulating in anticipation of better time ahead.
What is trading in a range?
Trading in a range means a stock is moving up and down between strong support and resistance zone in a horizontal range. It generally keeps moving between support and resistance for a short term.
In other words, it moves horizontally between higher and lower price areas in a somewhat predictable manner.
When price drops to the bottom of the range, buyers step in and support the price from slipping into a downtrend. When it reaches the top of the range, sellers step in and push the price down once again.
Most of the traders prefer buying the dips and selling the rallies to make money in this type of sideways market.
It’s also known as a neutral zone, as both buyers and sellers are equal in strength and the battle rages between the strong level of support and the resistance.
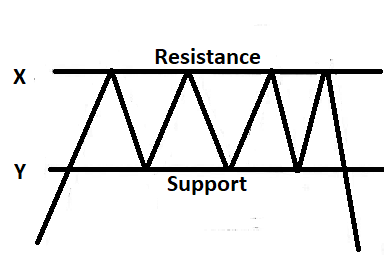
In the above diagram, the price moved between point X and Y at the top for sometime before going down.
The pattern that is formed between point X and point Y is known as a sideways market or trading in a range, where buyer and sellers are equally matched.
Point X is known as resistance and point Y as support area or zone.
Most trends are separated by some form of trading range.
The trading range separating rising and falling prices between point X and Y is known as the rectangle pattern.
Congestion
Congestion is a trend where the stock fluctuates in a tight unpredictable pattern that makes trading extremely difficult. Many traders avoid trading stocks that trade in congestion patterns.
Congestion zone is a range where stock can’t breathe as buyers and sellers are unable to make up their mind which way this stock should go. No uptrend and downtrend emerges during the congestion phase.
It might gaps open to the upside one day, then gaps down the next in a daily chart. In a lower trading time frame, you might find a short term up or down trend if the daily chart shows you a congestion pattern.
Consolidation
Consolidation is another sideways pattern which reflects the battle between buyers and sellers. When consolidation ends, the stock could move in either direction, up or down. It’s not that easy to identify in which direction the stock will break. In general, stocks try to continue the overall up/down trend after consolidation.
During high volatility, stocks can quickly move from an uptrend to a downtrend in a matter of minutes, nearly whipping out any sideways move. Similarly, they can go from a downtrend to an uptrend in minutes not even entering into the sideways phase.
How to trade sideways market
In the case of consolidation in between a strong uptrend, traders wait for prices to break the upper trendline of the consolidation phase to take a trade. It’s referred to as traders buying the breakout.
Instead of an uptrend, if consolidation happens in a strong downtrend, traders will wait for a break to the lower trend line of the consolidation phase in order to enter a trade. This is referred to as traders selling breakdown.
We have 3 classic consolidation chart patterns to trade in a strong up and downtrend. They are flags, wedges and pennants.
If the market is range bound, then traders prefer to draw the strong support and resistance level to take traders. They buy at support and sell at resistance to make profit.
In general, traders avoid a congestion zone for trading. They wait for a clear breakout or breakdown to take a trade.
In addition to the disclaimer below, please note, this article is not intended to provide investing or trading advice. Trading in the stock market and in other securities entails varying degrees of risk, and can result in loss of capital. Most investors and traders lose money. Readers seeking to engage in trading and/or investing should seek out extensive education on the topic and help of professionals.