You may have heard the saying “the trend is your friend”.
The old saying “The trend is your friend” is a constant reminder that you always want to be on the more dominant side of price action. To understand what it is, you have to first understand, what is the trend?
By recognizing whether the bulls or bears are the more dominant group, you can be conscious of the trend and better prepared to stay on the right side of the market.
A bull is a market participant that expects or wants the market to move higher. Bull or bullish market is an expression to explain when the market goes up.
A bear, on the other hand, expects the market to decline and indicates a declining market.
The main purpose of looking at a stock chart is to help determine which direction the stock is going.
The direction of the market is known as the trend.
In this article, you will learn different trends in the stock market and how to trade them.
If you closely monitor the stock charts, you will find that stock prices move in one of three directions: up, down, and sideways. No other movements are possible.
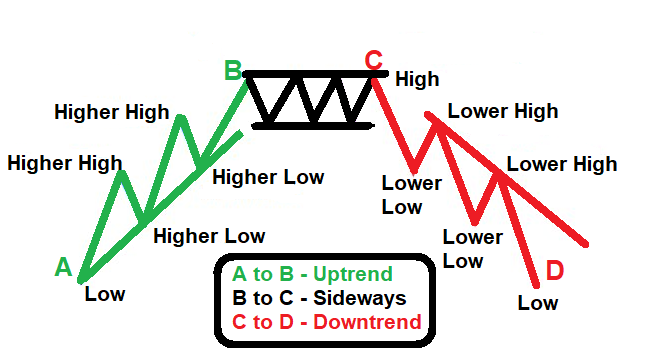
Uptrend – Rising Market
In an uptrend or rising market, the stock moves higher and higher.
In other words, an uptrend occurs when the stock price is making a series of higher highs and higher lows.
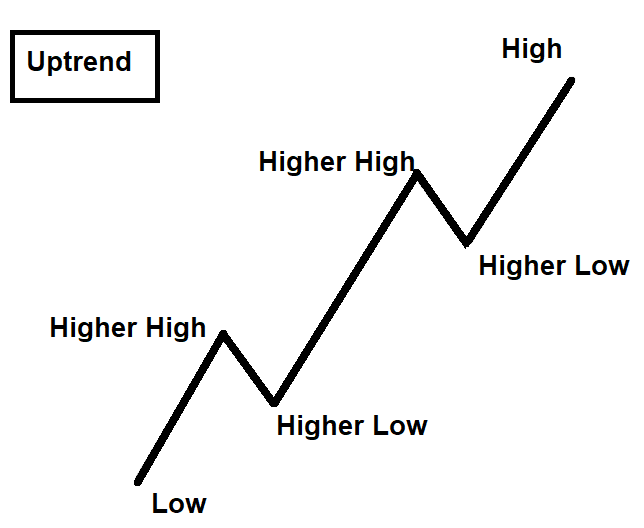
To remain in an uptrend, the stock’s price must keep making higher highs and higher lows.
As long as the stock price is making higher highs and higher lows, the uptrend is considered intact.
For bulls most profits are made when the market is in uptrend.
After an uptrend, prices may move sideways for a period of time before going down or up. Few traders call this time period as rolling over.
Sideways – Range bound market
Up and down trends or down and up trends are usually separated by a period where buyers and sellers are equally matched or become indecisive. During this transitional period, price typically moves within a trading range.
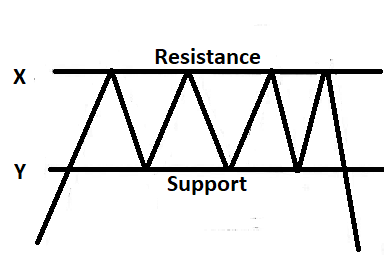
In the above diagram, when an uptrend is broken, buyers and sellers even out in strength, and the cycle arcs into a sideways pattern.The price moved between point X and Y at the top for sometime before going down.
The rectangle pattern that is formed between point X and point Y is known as a sideways market or a trading range, where buyer and sellers are equally matched.
During a sideways market, it’s very difficult to know in which way the prices will ultimately break. Until reversal by breaking the support zone happens, you can not say that the pattern is a reversal of the prevailing trend.
We have three different types of sideways markets. They are trading in a range, congestion and consolidation.
Trading in a range means a stock is moving up and down between support and resistance in a horizontal range. It generally keeps moving between support and resistance for a short term.
Congestion is a trend where the stock fluctuates in a tight unpredictable pattern that makes intra day trading extremely difficult. Many traders avoid trading stocks that trade in congestion patterns. Congestion is a range where stock can’t breathe as buyers and sellers are unable to make up their mind which way this stock should go.
Consolidation is another sideways pattern which reflects the battle between buyers and sellers. When consolidation ends, the stock could move in either direction, up or down. It’s not that easy to identify in which direction the stock will break. In general, stocks try to continue the overall up/down trend after consolidation.
Downtrend – Falling Market
The opposite of an uptrend is known as downtrend, when a security is making a series of lower highs and lower lows. Multiple lower lows and lower highs makes a downtrend.
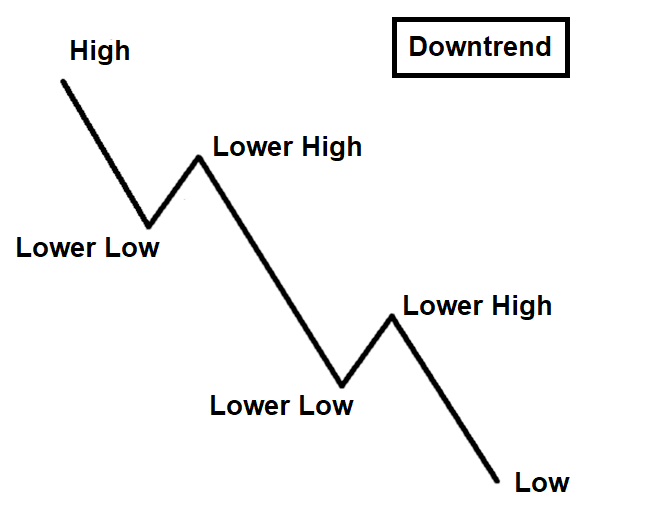
Downtrend starts when an uptrend starts gasping for breath as buyers are not willing to pay higher prices. At that moment sellers step in to take down the market. Many of these sellers are previous buyers who might have participated in the uptrend. Others are short sellers, who bet for the downtrend to make profit from the drop.
Downtrend considered to be over when prices close above a prior high in the downtrend.
After identifying the trend, traders decide whether to follow the present direction of the stock or market or to wait for a pullback or to stay on the sidelines. The challenge is identifying when the trend might end.
Buying when a stock dips and selling when it rallies is easier said than done. It’s a challenging strategy you have to master, if you want to be a successful day trader.
In addition to the disclaimer below, please note, this article is not intended to provide investing or trading advice. Trading in the stock market and in other securities entails varying degrees of risk, and can result in loss of capital. Most investors and traders lose money. Readers seeking to engage in trading and/or investing should seek out extensive education on the topic and help of professionals.