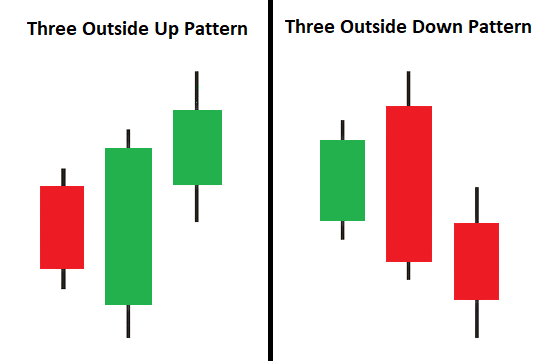
In technical analysis, candlestick patterns are a representation of the market structure. They tell us how bulls and bears interact with each other at any given time. Three outside up and three outside down is part of three-candle trend reversal patterns. As the name suggests, three candles in a specific sequence are needed to complete the pattern.
Formation of three outside up/down candlestick patterns indicates that the current trend has lost its momentum and might reverse in the opposite direction.
The three outside up is a bullish candlestick pattern and the three outside down is a bearish candlestick pattern.
Three outside up candlestick pattern
The first candle of the three outside up patterns is a bearish candle, the second bar opens with a gap down from the first but bulls push the price up to close it higher than the open of the first candle to form an outside candle. To complete the pattern, on the third bar, bulls pushed the prices higher than the high of the second candle.
Outside means the price action of the second candle traded outside the high and low of the first candle.
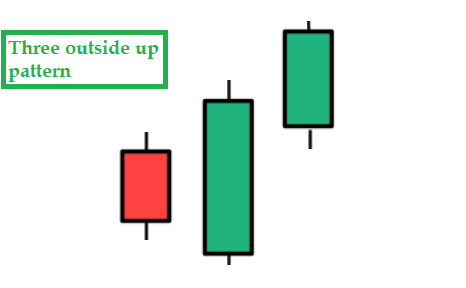
If you are getting three outside up candlesticks pattern in the daily chart, it means, the first day is a down day, the second day is a up day and it’s a outside day relative to the first down day, and then the third day completed with an up bar closing above the second day high.
Rule of recognition
Here are the set of rules or conditions to be satisfied to get a confirmation that the pattern is a three outside up candlestick pattern.
- The market is in a downtrend
- The first candle is a bearish candle showing continuation of the bearishness in the market.
- The second candle is a bullish candle which gaps down but completely engulfs the bearishness of the previous candle.
- The third candle is a bullish candle with an open at or little below the close of the second candle but closes higher than the second candle.
Three outside down candlestick pattern
Three outside down candlesticks pattern is a trend reversal signal that indicates an end to the strong uptrend. First candle is a continuation of the bullish candle of the uptrend.
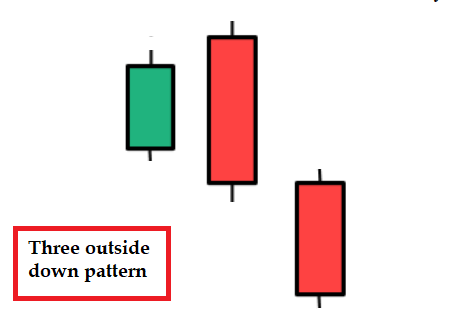
Second candle starts with a gap up opening, showing that bulls are still in control, however they don’t control the price action for long as bears stepped in and took the control to bring the price down. The second candle has a close lower than the first candle’s low. Therefore, the second candle is considered as an outside candle relative to the first bullish candle.
The third candle is a continuation to the bearish outside bar in which bears have full control after its open to close.
Rule of recognition
Here are the set of rules or conditions to be satisfied to get a confirmation that the pattern is a three outside down candlestick pattern.
- The market is in an uptrend.
- The first candle is a bullish candle showing continuation of the uptrend.
- The second candle is a bearish candle with a long body that completely engulf the first bullish candle.
- The third candle is a bearish candle with an open at or near the close of the second candle but closes higher than the second candle. Length of the third candle tells you the acceleration of the reversal to the downside.
Traders consider the three outside up and three outside down candlestick patterns as a reliable signal to go against the trend. However, confirmation from other technical indicators is an added advantage to take a trade.
In both the above candlestick reversal pattern, when the 2nd bar closes, the pattern is called the engulfing candlestick pattern which is part of the two-candle reversal pattern. Many traders consider trading bullish/bearish engulfing candlestick patterns instead of waiting for the third candle to form a three outside up/down candlestick pattern.
Here is a list of candlestick patterns for your reference;
- Evening Star
- Morning Star
- Bearish Abandoned baby candlestick pattern
- Bullish Abandoned baby candlestick pattern
- Three Inside up/down
- Inside Bar
- Bullish Piercing
- Dark Cloud Cover
- Spinning Top
- Shooting Star and Inverted Hammer
- Hammer & Hanging Man
- Gravestone, Dragonfly and long-legged Doji
- Engulfing Candlestick Pattern
- Spinning Top
- Marubozu
Be sure you practice identifying and trading these candlestick patterns on a demo account before trading them with real money.
In addition to the disclaimer below, please note, this article is not intended to provide investing or trading advice. Trading in the stock market and in other securities entails varying degrees of risk, and can result in loss of capital. Most investors and traders lose money. Readers seeking to engage in trading and/or investing should seek out extensive education on the topic and help of professionals.