• Skip to main content
  • Skip to primary sidebar
  • Skip to footer

Figyan

  • Income Tax
    • Income tax slab & rates for FY 2023-24 (AY 2024-25)
    • Income tax return filing deadlines
    • Guide to Personal income tax return
    • Important dates in income tax
    • Ultimate Guide to Salary Taxation in India
    • How TDS on Dividend Income Works in India
  • GST
    • Top 10 GST Mistakes
    • Income Tax vs. Goods and Services Tax (GST)
    • GST e-Way Bill
    • How to identify a fake GST bill
    • Invoices issued under GST law
    • GST Reconciliation-Form GSTR-9C
    • GST Annual Return Form GSTR-9
  • TDS
    • Guide to TDS on Interest Income: Section 194A
    • TDS on Payments to Contractors and Professionals: Section 194M
    • Section 194T: TDS on Payments to Partners of Partnership Firms
    • Section 194J: TDS on fees for professional or technical services
    • TDS on commission and brokerage – Section 194H
    • Section 194D – TDS on Insurance Commission
  • MOA – Samples
    • Consulting company
    • Tour and travel
    • Restaurant
    • Data Processing
    • Real estate developers
    • Information technology
  • Income Tax Slabs 2025
Home » Finance » Parallel uptrend and downtrend price channels in trading

Parallel uptrend and downtrend price channels in trading

Last reviewed on February 22, 2026 I By CA Bigyan Kumar Mishra


A channel forms when the price action of a stock or asset is controlled by 2 parallel, sloping lines. To know how effective the channel lines are, you must make sure that it has tested each of these lines at least twice.

Please note, we are not talking about television channels. These are trend channels drawn on price charts in order to understand price action, sometimes also called price channels.

A parallel uptrend channel slopes up and borders higher lows as well as higher highs in a rising market. Likewise, a downtrend channel slopes down and borders lower highs as well as lower lows during declines.

The area between these parallel channels is known as the trend channel.

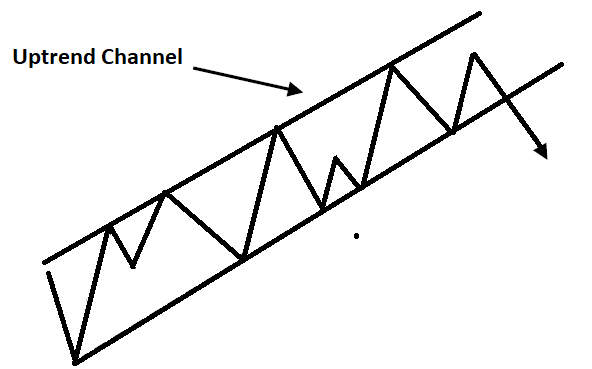
An ascending channel as shown above indicates a bullish trend, with the support line connecting consecutive higher lows and the resistance line connecting consecutive higher highs. 

The lower line in the parallel uptrend channel is considered as support and the top line is as resistance. The support line of an ascending channel is a buy zone. When price touched the support line, many traders considered buying the security and when price touched the upper resistance line, they book profit.

Likewise, in an established parallel downtrend channel, when price touches the upper resistance line, it’s considered to sell (short) into the downtrend. The lower support line is considered as the target to book profit.

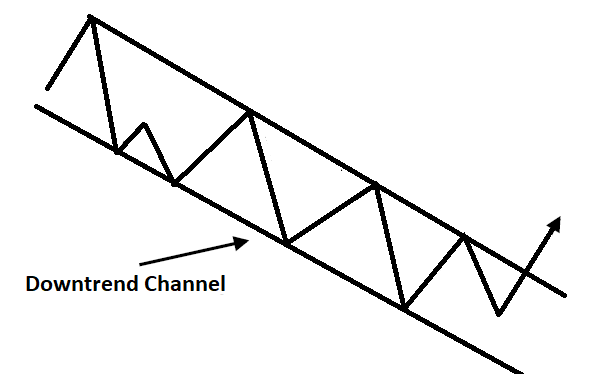
A descending channel as shown above indicates a bearish trend, with the support line connecting consecutive lower lows and the resistance line connecting consecutive lower highs.The resistance line of a descending channel is a sell zone.

Violation of the upper supply line indicates the trend will accelerate or a temporary reversal will take place. If the violation is much steeper, it might be an exhaustion move.

Any failure of the price to hold upper or lower channel lines, signals an important reversal in prevailing trend. Additional confirmation can be obtained from volume. If at the break, we have a high volume, then trend reversal is confirmed.

It’s very difficult to find a perfect parallel trend channel with regular higher highs and higher lows.

We also have a horizontal channel in which trend lines are drawn horizontally, which is nothing but trading in a range or a sideway market.

Remember, you wont get a picture perfect textbook example in the real world. Therefore, getting a perfect price channel where trend lines are drawn parallel to each other is very rare.

In addition to the disclaimer below, please note, this article is not intended to provide investing or trading advice. Trading in the stock market and in other securities entails varying degrees of risk, and can result in loss of capital. Most investors and traders lose money. Readers seeking to engage in trading and/or investing should seek out extensive education on the topic and help of professionals.

Categories: Finance

About the Author

CA. Bigyan Kumar Mishra is a fellow member of the Institute of Chartered Accountants of India.He writes about personal finance, income tax, goods and services tax (GST), stock market, company law and other topics on finance. Follow him on facebook or instagram or twitter.

Primary Sidebar

Popular on Blog

  • Key Features of the Income Tax Act, 2025
  • Complete Guide to Starting a Partnership Business in India: Key Features, Benefits, and How to Register
  • Difference between intraday and delivery trading
  • 5 Best finance Job search websites you must check out In India
  • Essential Documents You Need to File Your Income Tax Return
  • A Simple Guide to Registering a Private Limited Company in India
  • How goods and services tax or GST is paid in India
  • Things to remember while filing Partnership firms tax return
  • Updated income tax return: eligibility, timeframe, form & importance
  • Income tax rates for partnership firms & LLPs for FY 2022-23 (AY 2023-24)
  • Corporate tax rates in India for FY 2024-25 (AY 2025-26)

Don’t see a topic? Search our entire website:

Footer

Trending Now

  • Top 10 Highest-Priced Stocks in the World in 2026
  • GST registration in India – All you need to know
  • Top 10 Most Valuable Companies in the World by Market Capitalization (2025)
  • How a sole proprietorship business is taxed in India
  • How Partnership firms are taxed in India – All you need to know
  • How tax deducted at source works – all you need to know on TDS
  • Taxation on Cryptocurrency: A Guide to Crypto Taxes in India
  • QRMP Scheme in GST Explained: Quarterly Returns Guide for Beginners in India

Email Newsletter

Sign up to receive email updates daily and to hear what's going on with us!

Privacy Policy

Stay In Touch With Us

  • Facebook
  • Instagram
  • Tumblr
  • Twitter

Legal Disclaimer

The information available through this Site is provided solely for informational purposes on an “as is” basis at user’s sole risk. The information is not meant to be, and should not be construed as advice or used for investment purposes. Figyan.com … Read More about Disclaimer

  • About Us
  • Disclaimer
  • Privacy Policy
  • Terms of Use and Policies
  • Write For Us
  • Contact Us

Copyright © 2026 Figyan.com · All Rights Reserved