Trend lines are essential tools in technical analysis, providing valuable insights into price movements and market trends. By connecting significant points on a chart, trend lines help traders and investors make informed decisions. We’ll explore what trend lines are, how they function, and their importance in stock trading.
Trend lines are one of the most useful and important tools for technical analysts in financial markets. They help analysts identify and track market trends, showing the general direction of price movement. By drawing a line connecting two or more price points, trend lines make it easier to see whether prices are rising, falling, or staying the same. These lines are essential for anyone looking to understand and predict the future direction of a market.
Like horizontal support and resistance lines, trend lines are also drawn by connecting price highs and lows. However, with trend lines, you must connect the dynamic highs and lows as the market moves forward. This is because the direction of the trend can change over time, so the trend line needs to be adjusted to reflect the most recent price action. This helps analysts stay updated on the current trend and make better predictions about future price movements.
Trend lines should always be redrawn if the price moves faster in the direction of the trend. When price action picks up speed, the previous trend line might no longer reflect the true direction of the market. By adjusting the trend line to match the new price movement, analysts can maintain an accurate view of the market trend and make better decisions based on the latest price behavior.
In this article, we will discuss how to draw up-trend and down-trend lines, and when horizontal trend lines are drawn to identify support and resistance levels.
How to draw trend lines
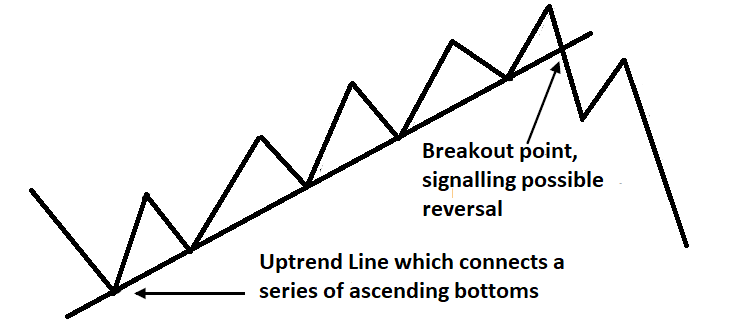
In a rising market, a trend line is a straight line drawn by connecting a series of ascending bottoms. It’s called up-trend lines.
Likewise, in a falling market, a trendline is a straight line connecting a series of peaks. It’s called down trend lines.
In order to consider a trend line as a significant trend line, it must connect two or more peaks or troughs. If it only touches one point, it cannot be considered as a true trend line.
Some technical analysts prefer three touches as minimum to consider it as a significant trend line. There are no specific rules defined for this, it depends on the trader.
The up-trend or down-trend line derives its authority from the number of times it has been touched, i.e. the larger the number, the greater the significance. Remember, if the price approaches the line, it’s almost as important as an actual touching.
Here is the diagram showing how down-trend line is drawn in a falling market.
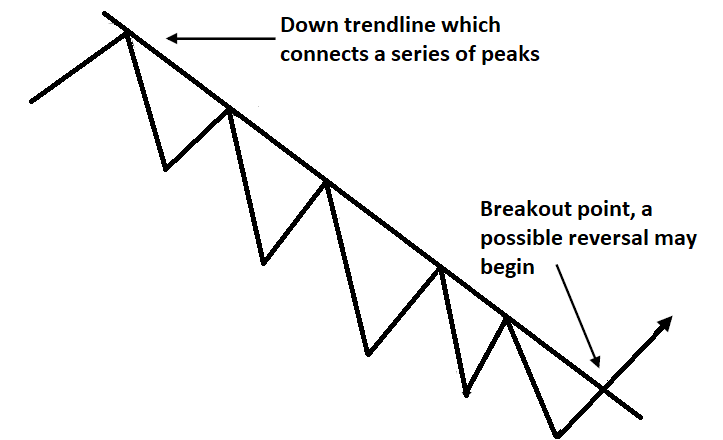
In a down-trend, trend lines are drawn by connecting at least two highs or three highs with a line.
In an uptrend, a trend line is drawn by connecting at least two or three lows with a line.
The more time prices touch the trend line, the more valid it is.
Here is how the up-trend line is drawn in a rising market.
Trend line breaks are watched very closely by technical traders.
In an uptrend, when the uptrend support trend line breaks, a possible reversal may begin. Before the reversal, price might consolidate for sometime or even break above the trend line again before a downtrend.
Trend lines are drawn to identify current trends, or to help you confirm a reversal of the current trend.
If the prices are under a trend line, the overall direction of the trend is down. If the prices are above the trend line, the overall direction is up. When price breaks through the trend line, it’s likely that prices will reverse direction.
While drawing trend lines, few traders prefer to connect the candlestick bodies while others try to connect the wicks/shadows of the candle. There is no right or wrong method, it depends what works for you.
You can draw trend lines mentally by eyeing the chart or physically, by drawing the line with your trend line charting tool.
In a rising market, the uptrend line acts as a support and in a falling market, the downtrend line acts as a resistance.
Trend line shows the direction where the stock’s current trend is expected to go. It creates a boundary to know when the trend is getting over.
Many traders also use channel lines to analyse how a stock moves. Channel lines are parallel lines drawn along the tops of uptrend price patterns, and along the bottom of downtrend price patterns. These lines are also used as profit taking points.
When price penetrates the rising trendline and closes below it, then that is an indication to change in trend.
An up-trend line is officially not considered as broken until a previous low is surpassed. Likewise, a down-trend line is considered to be broken when the previous high is surpassed.
A break above the declining trendline is bullish, while a break below the advancing trend line is bearish.
Horizontal trend line
In a sideways market, trend lines can be drawn horizontally connecting the upper and lower boundaries of the trading range.
In the head-and-shoulders price pattern, the neckline drawn connecting low points of the head and shoulders is also known as horizontal trend lines. Penetration of price below or above these horizontal line signals possible trend reversal.
Penetration of a trend line can signify either:
- a reversal in the previous trend, or
- a continuation of the present trend after consolidating for sometime.
After consolidation, it might continue the present trend or reverse.
In other words, at the point of violation, the odds strongly favour a change in trend. Such change in trend can be a reversal or consolidation before resumption in trend or reversal. No one knows which possibility will prove to be the outcome.
Trend lines are the easiest technical tool to identify trend and reversal. It requires practice and experimentation to master such an art.
How Trend Lines Help Traders?
Trend lines can significantly assist traders in identifying ideal buying opportunities. Here’s how they function:
- Support Mechanism: The trend line often acts as a support level. When the stock price pulls back towards this line, it may present a good entry point for purchases.
- Risk Management: As the stock pulls back from a high, placing a stop-loss order just below the last low allows traders to limit potential losses if the stock continues to decline.
Channel Lines: An Extension of Trend Lines
Channel lines are parallel lines drawn alongside trend lines, creating a visual representation of a price channel. A rising channel line is positioned above the price action, showing the highest points the stock has reached.
How Channel Lines Help Traders
Channel lines assist traders in determining support and resistance levels:
- Short-Term Trading: For short-term traders, channel lines indicate when to take profits or re-enter a stock. If a stock hits the upper channel line, it may signal the right time to sell and wait for a better buying opportunity.
- Long-Term Investing: Long-term investors can use channel lines to identify strong buying points. A breakout above the upper channel line often serves as confirmation that it’s a good time to buy.
Conclusion
Trend lines and channel lines are powerful tools for traders and investors alike. By understanding how to draw and interpret these lines, traders can make informed decisions about entry and exit points, manage risks effectively, and optimize their trading strategies.
Incorporating trend lines into your trading toolkit not only enhances your ability to analyze market movements but also increases your potential for success in the stock market. Whether you’re a long-term investor or a short-term trader, mastering trend lines is key to navigating the complexities of stock trading.
In addition to trend line break or reversal, technical analysts prefer to refer to other technical tools for confirmation. List of Candlestick Patterns for your further studies;
- Evening Star
- Morning Star
- Bearish Abandoned baby candlestick pattern
- Bullish Abandoned baby candlestick pattern
- Three Inside up/down
- Three outside up/down
- Inside Bar
- Bullish Piercing
- Dark Cloud Cover
- Spinning Top
- Shooting Star and Inverted Hammer
- Hammer & Hanging Man
- Gravestone, Dragonfly and long-legged Doji
- Engulfing Candlestick Pattern
- Marubozu candlestick pattern
Disclaimer: In addition to the disclaimer below, please note, this article is not intended to provide investing or trading advice. Trading in the stock market and in other securities entails varying degrees of risk, and can result in loss of capital. Most investors and traders lose money. Readers seeking to engage in trading and/or investing should seek out extensive education on the topic and help of professionals.