One of the most common price patterns traders and other market participants use in the stock market is a triangle.
Triangle is considered as a continuation pattern, which means the stock might move in the same direction after a pause along the way. It can be a bullish or bearish move, but the overall trend is not disrupted.
Triangle is perhaps the most prevalent continuation chart pattern on any chart.
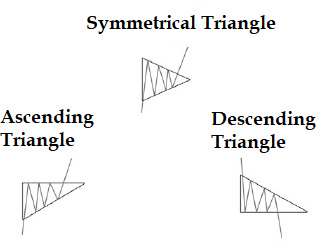
We have following three main type of triangles;
- Ascending
- Descending
- Symmetrical
Ascending triangle
In an ascending triangle, the stock or security is making higher lows, but the highs remain the same.
This type of price pattern indicates that the stock or security is facing resistance at the top. However, every time price falls from the resistance,bulls are stepping in to buy the security, thereby creating the ascending triangle pattern.
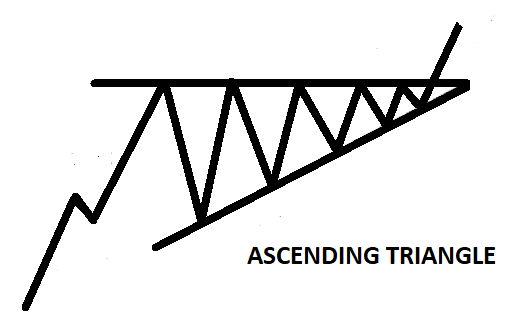
As shown in the above diagram, the lower line connecting the higher lows of the ascending triangle acts as a support line. The upper line connecting the highs of the stock or security acts as a resistance line.
It consists of a horizontal top border with a lower border that is sloped upward. While the top is flat or static, the lower border is essentially a rising support trend line.
Ascending triangle is a bullish pattern.
Descending triangle
The inverted image of an ascending triangle is known as a descending triangle.
The lower line of the descending triangle acts as a support line and the upper line acts as a resistance line.
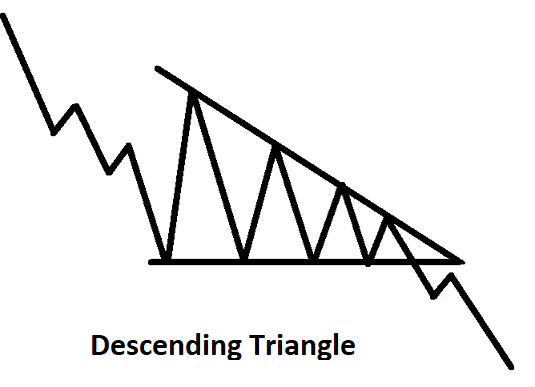
In it, every time buyers are trying to take the stock up, bears are stepping in to sell the stock, thereby creating a descending triangle pattern.
It consists of a horizontal bottom border with an upper border that is sloped downward.
Descending triangle is a bearish pattern.
Both ascending and descending triangles have one border that is horizontal, or at least very close to horizontal.
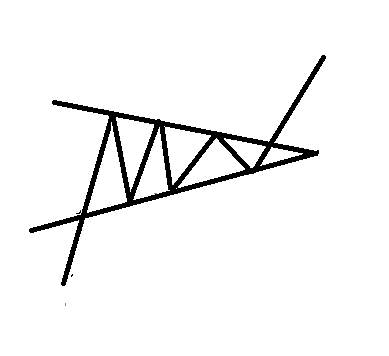
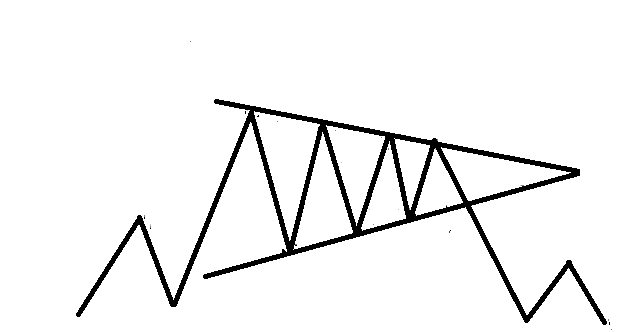
Symmetrical triangle
Symmetrical triangle is formed by two or more rallies and reactions. In such formation, each peak is lower than its predecessor and the bottom of each reaction is higher than its predecessor. Following diagram shows how a symmetrical triangle is formed.
Symmetrical triangles are also known as flags and pennants. It shows a tight battle between bulls and bears. These type of price patterns indicate that the stock is resting for a while by moving sideways before continuing to trend higher or lower.
After the pattern formation, there will be a strong move, up or down.
Symmetrical triangle does not give any clue to the direction of breakout. Technical analysts always prefer to assume that the breakout will be in the direction of the trend if it is not matured, otherwise, it can be considered as a reversal.
Below diagram shows how a symmetrical triangle can break in the opposite direction of a trend.
In a triangle chart pattern, the direction of break might be in the direction of the prevailing trend. However, this is not always the case. Often price breaks out in the opposite direction of the trend.
The nature of the break is more important than the direction of the break. If the break is with high momentum, then chances are that there will be follow through in the direction of the break.
Technical analysis is not 100% reliable. In addition to these types of price patterns, many traders also look at various bullish and bearish candlestick patterns for clues to know when to buy or sell a stock. One of the biggest advantages of candlesticks is that it shows the force of the current move.
Here are the most popular candlestick patterns:
- Evening Star
- Morning Star
- Bearish Abandoned baby candlestick pattern
- Bullish Abandoned baby candlestick pattern
- Three Inside up/down
- Three outside up/down
- Inside Bar
- Bullish Piercing
- Dark Cloud Cover
- Spinning Top
- Shooting Star and Inverted Hammer
- Hammer & Hanging Man
- Gravestone, Dragonfly and long-legged Doji
- Engulfing Candlestick Pattern
- Marubozu candlestick pattern
Disclaimer: In addition to the disclaimer below, please note, this article is not intended to provide investing or trading advice. Trading in the stock market and in other securities entails varying degrees of risk, and can result in loss of capital. Most investors and traders lose money. Readers seeking to engage in trading and/or investing should seek out extensive education on the topic and help of professionals.