A wedge is a price pattern formed as a small triangle during a strong directional up or down move. In wedge formation, price consolidates between two converging trend lines.
The two trend lines are drawn by connecting the respective highs and lows. Lines drawn show that the highs and lows of the price pattern are either rising or falling.
Wedge shaped trend lines are considered as a reversal indicator in price action by technical analysts. This means depending on the direction of the market, a wedge pattern can signal either bullish or bearish price reversal.
The pattern may be considered as a rising or falling wedge depending on its direction.
Rising wedge pattern
When price consolidates between two upward sloping lines, it’s known as a rising wedge chart pattern.
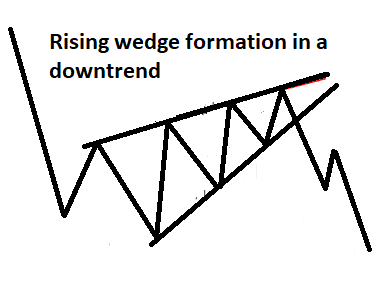
Rising wedge pattern occurs when a stock is rising over time. It also occurs in the middle of a downtrend.
A rising wedge in a falling market is considered as a bearish continuation chart pattern.
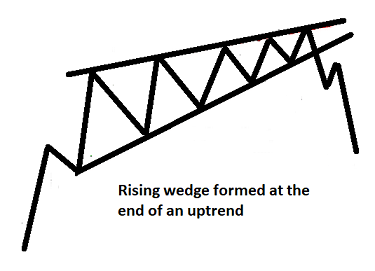
However, a rising wedge formation after an uptrend is considered as a bearish reversal pattern. Notice how the rising wedge is formed when the stock begins making higher highs and higher lows within two converged trendlines.
Rising wedge formed after an uptrend and as a continuation to a downtrend is a bearish chart pattern which leads to downward move.
The trend line drawn above and below the price chart pattern can converge to help a trader anticipate a reversal.
Wedge pattern has a tendency to break in the opposite direction from the trend lines.
A rising wedge indicates prices will most likely fall after a breakout of the lower trend line.
In general, traders go short after the breakout of lower trendline with a stop loss just above the wedge pattern.
Falling wedge pattern
On the other hand, when price consolidates between two downward sloping lines, it’s known as a falling wedge.
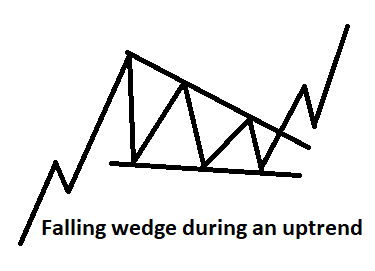
A falling wedge in a rising market is considered as a bullish chart pattern. Both lines within which price consolidates act as support and resistance lines. In an uptrend, it’s considered as a continuation pattern and in a downtrend, it acts as a reversal.
In a downtrend, a falling wedge is formed when price starts making lower highs and lower lows. Here is how a falling wedge is created after a downtrend.
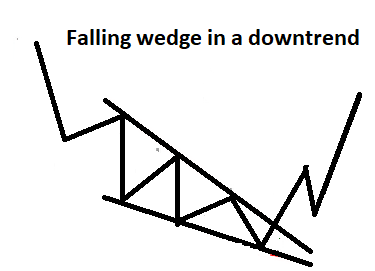
As you can see in the above diagram, buyers stepped in after a breakout above the upper trend line. When the stock breaks the upper trend line, it is expected to reverse and trend higher.
In an uptrend, a falling wedge serves as a bullish continuation signal. After breakout, the trend will resume.
Is a Wedge a Continuation or a Reversal Pattern?
Wedge patterns indicate a reversal, which can be bearish or bullish depending how the trend lines converge.
If a falling wedge pattern occurs in an uptrend, it’s considered as a bullish chart pattern. In an uptrend, a rising wedge pattern is considered as bearish.
In a downtrend, a rising wedge pattern is seen as a bearish chart pattern. A falling wedge pattern in a downtrend is considered as a bullish chart pattern.
This means, a rising wedge pattern is bearish and a falling wedge pattern is bullish.
List of Candlestick Patterns for your further studies;
- Evening Star
- Morning Star
- Bearish Abandoned baby candlestick pattern
- Bullish Abandoned baby candlestick pattern
- Three Inside up/down
- Three outside up/down
- Inside Bar
- Bullish Piercing
- Dark Cloud Cover
- Spinning Top
- Shooting Star and Inverted Hammer
- Hammer & Hanging Man
- Gravestone, Dragonfly and long-legged Doji
- Engulfing Candlestick Pattern
- Marubozu candlestick pattern
Disclaimer: In addition to the disclaimer below, please note, this article is not intended to provide investing or trading advice. Trading in the stock market and in other securities entails varying degrees of risk, and can result in loss of capital. Most investors and traders lose money. Readers seeking to engage in trading and/or investing should seek out extensive education on the topic and help of professionals.